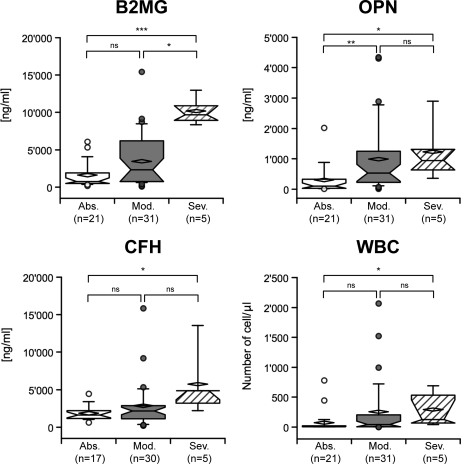
Fig. 5.
Box-plot of B2MG, OPN, CFH concentrations, and WBC number, classified according to the severity of neurological signs. Median and mean are represented as a solid line in the box and a diamond, respectively. Whisks are defined as 5th–95th percentile with outliers. Half-width of the notch was calculated automatically by the software. *** corresponds to a significant difference between the two groups < 0.0001; ** corresponds to a significant difference < 0.01 and * < 0.05; ns indicates a nonsignificant difference (Dunn's post-hoc test). Abs, absence of neurological signs; Mod, moderate neurological signs; Sev, severe neurological signs.

