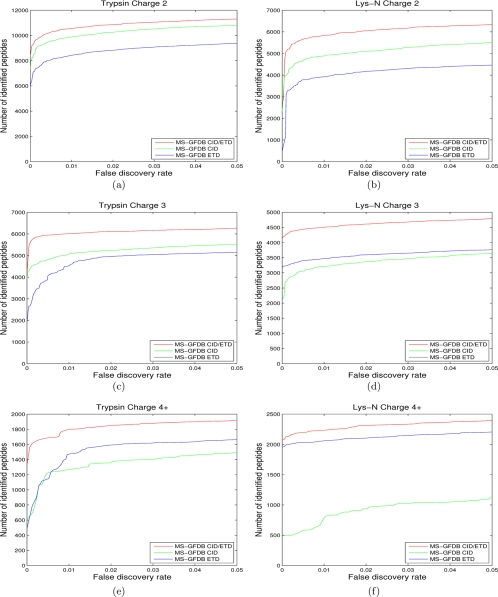
Fig. 8.
Number of identified peptides with MS-GFDB CID/ETD from (a) charge 2 spectral pairs in CID-Tryp and ETD-Tryp, (b) charge 2 spectral pairs in CID-LysN and ETD-LysN, (c) charge 3 spectral pairs in CID-Tryp and ETD-Tryp, (d) charge 3 spectral pairs in CID-LysN and ETD-LysN, (e) spectral pairs of charges 4 and larger in CID-Tryp and ETD-Tryp, and (f) spectral pairs of charges 4 and larger in CID-LysN and ETD-LysN. Number of identified peptides with MS-GFDB are also shown for reference. The number of peptide identifications is plotted against the corresponding peptide level FDR. FDRs were separately computed for spectra of precursor charge 2, precursor charge 3, and precursor charge 4 and larger. Red curves represent MS-GFDB CID/ETD, green curves represent MS-GFDB CID and blue curves represent MS-GFDB ETD. For all the cases considered, MS-GFDB outperformed both MS-GFDB CID and MS-GFDB ETD.

