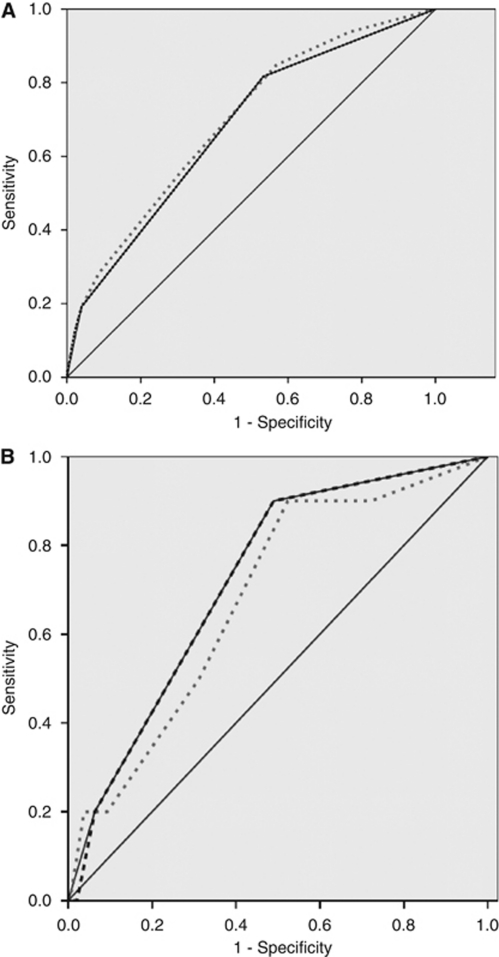
Figure 2.
Area under receiver operator curves. (A) STBSG database. Grey dotted line: logistic regression-based scoring; black dotted line: χ2 interaction detection algorithm; black line: performance status alone as prognostic model (this line completely covers the CHAID algorithm line). (B) FSG database. Grey dotted line: logistic regression-based scoring; black dotted line: χ2 interaction detection algorithm; black line: performance status alone as prognostic model (this line completely covers the CHAID algorithm line).

