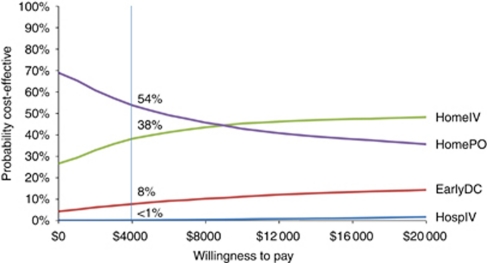
Figure 3.
This chart presents the cost-effectiveness acceptability curve for the base–case analysis. The curves represent the proportion of simulations in which oral outpatient therapy and IV outpatient therapy, respectively, were the cost-effective option at various WTP thresholds. For example, at a WTP threshold of $4000 per quality-adjusted febrile neutropaenia episode (vertical axis), oral therapy was cost effective in 54% of the simulations.

