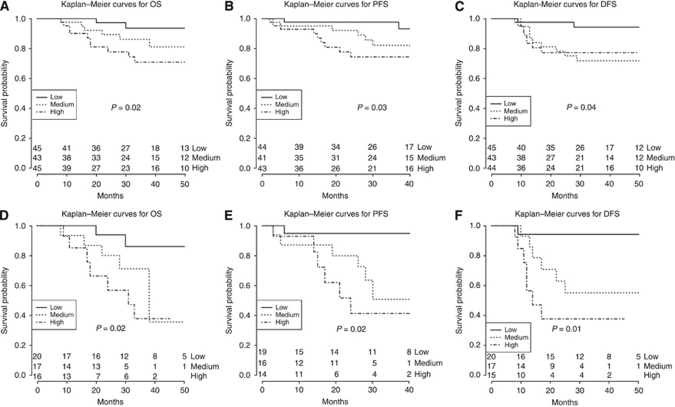
Figure 4.
Kaplan–Meier survival curves for EC patients according to sHE4 levels on the entire patient cohort (A, overall survival; B, progression-free survival; C, disease-free survival) and on poorly differentiated subgroup of EC patients (D, overall survival; E, progression-free survival; F, disease-free survival). P-values refer to the comparison between high vs low tertile, except for C, in which medium vs low tertile shows to be significant.

