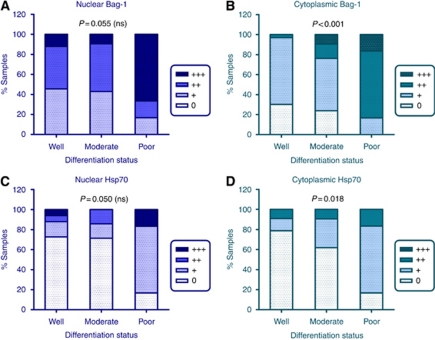
Figure 4.
Expression of Bag-1 and Hsp70 in human SCC in relation to differentiation of the stained section. (A) Intensity of Bag-1 nuclear staining in well, moderately and poorly differentiated tumours. (B) Intensity of cytoplasmic Bag-1 staining in well, moderately and poorly differentiated tumours. (C) Intensity of nuclear Hsp70 staining in well, moderately and poorly differentiated tumours. (D) Intensity of cytoplasmic Hsp70 staining in well, moderately and poorly differentiated tumours. Statistical analysis was performed using a Kruskal–Wallis test. The numbers of tumours in each differentiation category were as follows: well (33), moderate (21), poor (6). ns, nonsignificant. 0=undetectable staining; +=weak; ++=moderate; +++=strong staining.

