Figure 5.
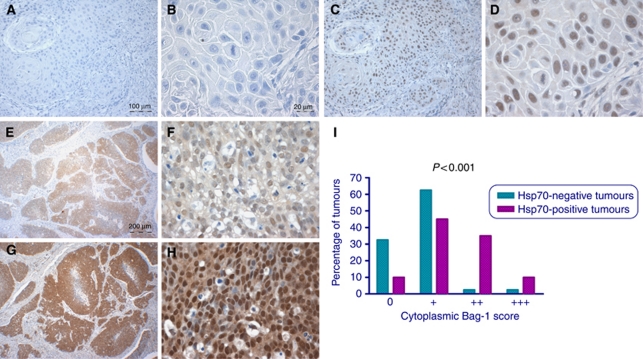
Correlation between Bag-1 and Hsp70 expression. (A and B) Epidermal SCC negative for Hsp70 staining. (C and D) Corresponding areas of the same tumour stained for Bag-1 showing weak cytoplasmic Bag-1 expression and moderate nuclear staining. (E and F) Epidermal SCC showing a moderate level of cytoplasmic and nuclear Hsp70 staining. (G and H) Corresponding areas of the same tumour shown in E and F stained for Bag-1, showing strong cytoplasmic and nuclear Bag-1 staining. Images E and G were photographed using a × 4 objective (scale bar shown in E), images A and C were photographed using a × 10 objective (scale bar shown in A) and images B, D, F and H using a × 40 objective (scale bar shown in B). (I) Relationship between Hsp70 positivity and intensity of Bag-1 staining in SCCs. Statistical analysis was performed using a Mann–Whitney test. 0=undetectable Bag-1 staining; +=weak; ++=moderate; +++=strong cytoplasmic Bag-1 staining scores.

