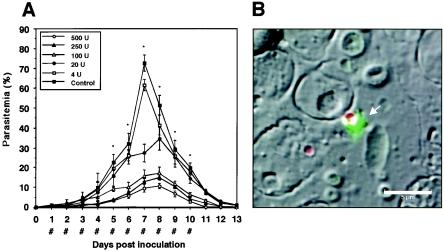
FIG. 5.
(A) Inhibitory effects of 500, 250, 100, 20, or 4 U of heparin 1 per mouse on the course of B. microti infection in mice. Each value represents the mean ± standard deviation for observations for 10 mice in each group. *, statistically significant differences (P < 0.01) between the group treated with 100 U of heparin and the control group; #, times of subcutaneous inoculation of heparin or the control reagent (PBS). (B) Localization of heparin-recognizing locus. B. microti-infected blood was preincubated with heparin-FITC, followed by fixation with acetone-methanol, and was then examined under a confocal laser scanning microscope. The heparin-antigen reaction (green) and nucleus (red) were visualized by staining with FITC and PI, respectively. Distinct fluorescence was detectable around free merozoites (arrow) but not the infected RBC. Bar, 5 μm.

