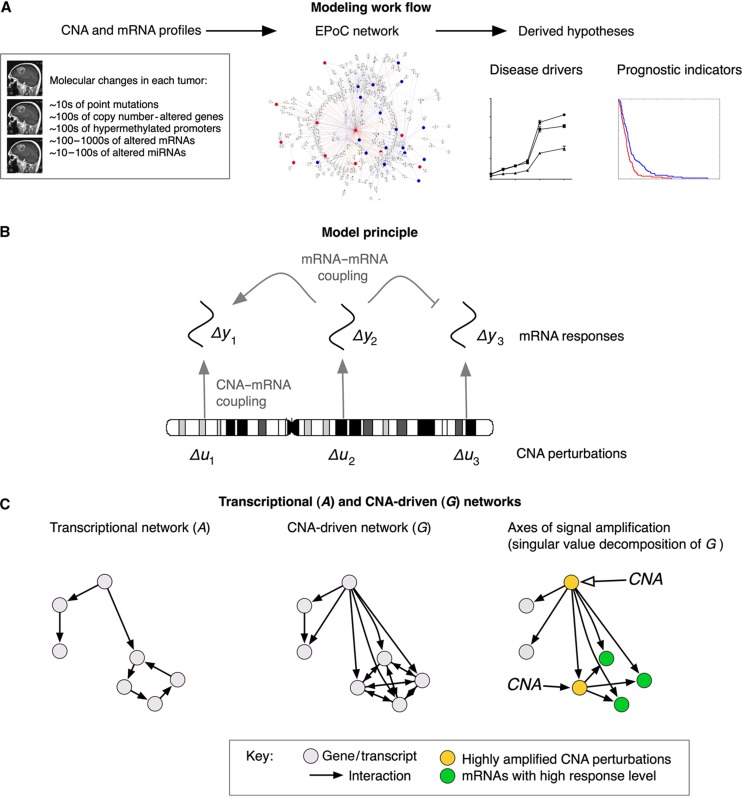
Figure 1.
Overview of the EPoC modeling framework. (A) Using genome-wide, paired mRNA- and DNA-level data as input, EPoC generates a quantitative causal network model of the global effects of copy number aberrations on mRNA expression. The resulting model is subsequently used to predict disease-driving genes and prognostic indicators. (B) EPoC is based on systems of differential equations that take into account that the transcription of a gene is determined both by its own DNA copy number (straight arrows) and the product of other genes (bent arrows). (C) Our method generates two mutually complementary networks denoted as A and G. The A network captures transcript–transcript interactions (left), whereas the G network contains the direct and indirect effects of CNA perturbations on transcription (middle). The singular value decomposition of G can be used to identify the CNAs whose perturbations are maximally amplified by the network (i.e., they have a strong overall transcriptional effect; yellow nodes), and the mRNA transcripts whose expression are most altered by these perturbations (green nodes; right panel).

