Figure 2.
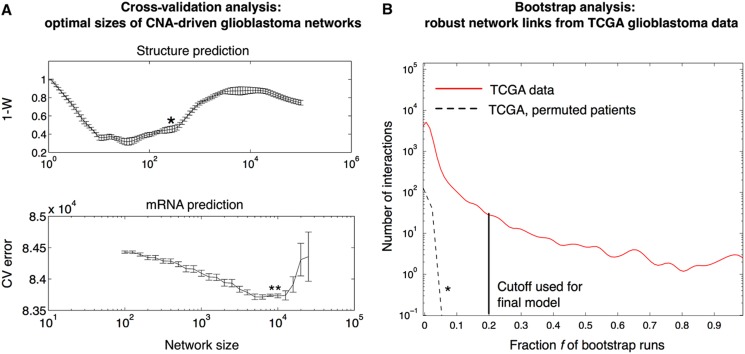
Derivation of robust and optimally sized network models for glioblastoma. (A) To select the network size, we use a customized validation technique in which networks generated in random data splits are compared using a rank correlation metric (one minus Kendall's W). Upper panel: Using this approach, we find glioblastoma networks with 200–500 interactions to be the structurally most consistent. The preferred network size is indicated by an asterisk (*) (details in Materials and methods). Lower panel: To assess the ability of a model to predict mRNA levels from CNAs, we estimate the normalized sum-of-squares prediction error by 10-fold cross-validation. This cross-validation identifies optimal networks of about 10 000 interactions. (B) We infer a robust CNA-driven network of size 512 from 186 paired gene expression and gene copy number profiles provided by The Cancer Genome Atlas (TCGA) consortium. For each of 1000 pseudo-bootstrap data sets, we generate a network of size around 400 (as obtained in Figure 2A). The final network retains interactions that appear in at least a fraction f of the bootstrap networks (frequency distribution shown as red curve). As a negative control, we permute the patients in the CNA data set (but not in the mRNA data) and repeat the estimation procedure, producing low frequencies for all individual interactions (dashed black curve and *). On the basis of these results, we here use f=20% (black line) as a frequency cutoff to generate our network model (Figure 3), which is well above frequencies expected by chance.

