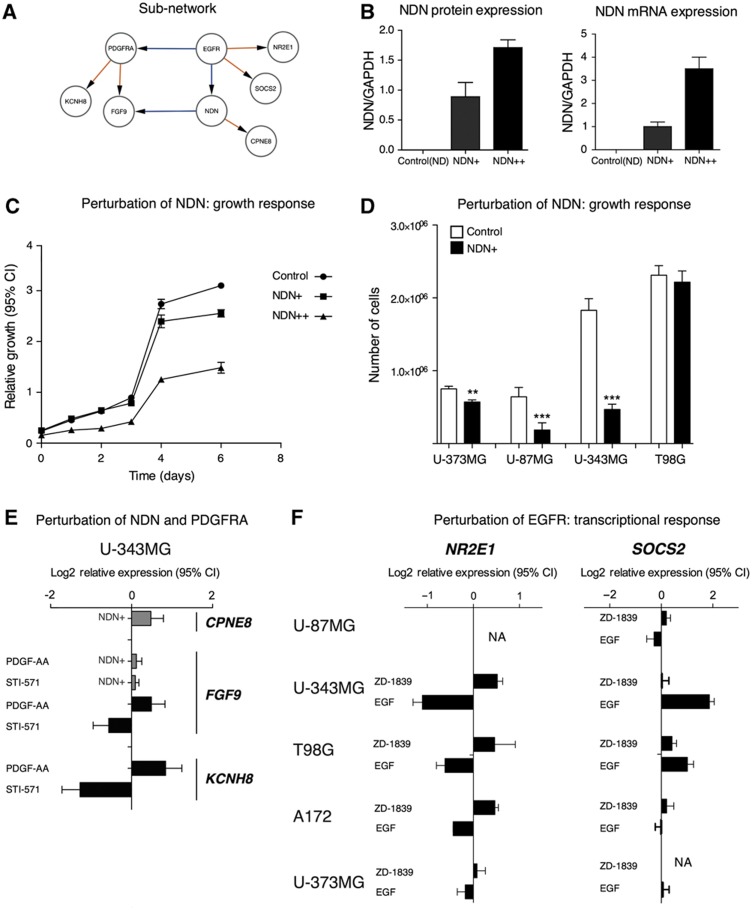
Figure 4.
Experimental perturbations of a network region controlled by NDN and PDGFRA. (A–D) NDN overexpression slows the growth of glioblastoma cell lines. (A) Interactions in the network around EGFR, NDN and PDGFRA. (B) Perturbation of NDN by stable overexpression in two separate U343-derived cell lines, denoted as NDN+ (moderate overexpression) and NDN++ (high overexpression). (C) Growth curves collected during 6 days showed that NDN overexpression inhibits growth of U343 cells. Error bars indicate 95% confidence intervals. (D) Single-time point (7 days) measurement of cell number in NDN-overexpressing cells. Error bars indicate s.e.m. (E) Perturbation of PDGFRA by PDGF-AA protein (ligand) and imatinib (STI-571; Gleevec™; inhibits PDGFRA and certain other tyrosine kinases), respectively, produces opposite responses in target genes KCNH8 and FGF9, which were identified as downstream targets of PDGFRA in the model. NDN overexpression induces CPNE8 target genes and modulates FGF9 response to PDGFRA. Error bars indicate 95% confidence intervals of mRNA expression log2-relative to untreated controls. (F) Perturbation of EGFR by its ligand EGF and gefitinib (ZD-1839 Iressa™; inhibits EGFR) produces opposite responses in the predicted EGFR target genes SOCS2 and NR2E1.

