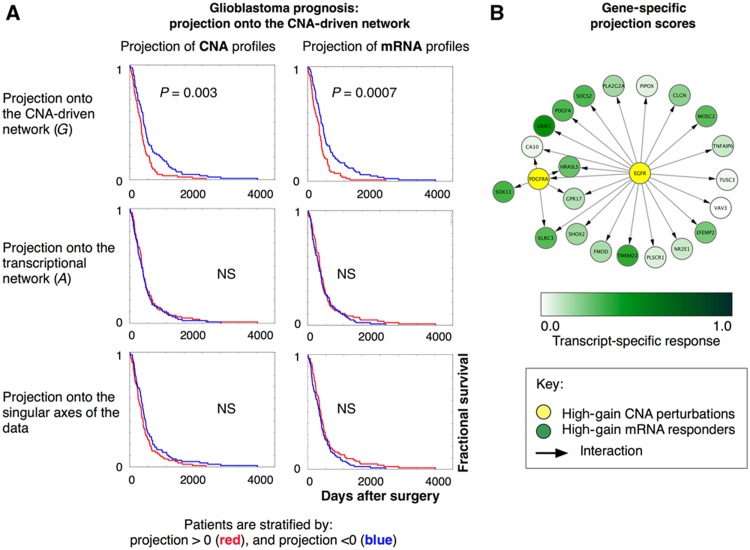
Figure 5.
Derivation of prognostic scores from the network model. (A) Kaplan–Meier curves to assess prognostic scores extracted from the CNA-driven network. Prognostic scores are computed by a sparse singular value decomposition of the CNA-driven network G (Materials and methods). Patients are divided into two groups by projecting their CNA profiles and mRNA profiles onto the main left and right axis of the singular vectors of G, respectively. This separates patients with favorable and poor prognosis (upper panels). By contrast, the corresponding analysis of the transcriptional network A (middle panels) does not produce any significant separation of patients in terms of survival, nor does a standard singular value decomposition (SVD) of the mRNA profiles or CNA profiles (lower panels). The panels show the results obtained by projection onto the first SVD components. The results obtained when projecting onto additional components are given in Table II. (B) The sparse singular value decomposition of the CNA-driven network G identifies genes with strong scores for signal amplification, i.e., genes whose perturbations are highly amplified by the network system (here illustrated as yellow nodes, e.g., PDGFRA), as well as mRNA transcripts that are most affected by these perturbations (green nodes, e.g., GRIK1; Figure 1C).

