Fig. 2.
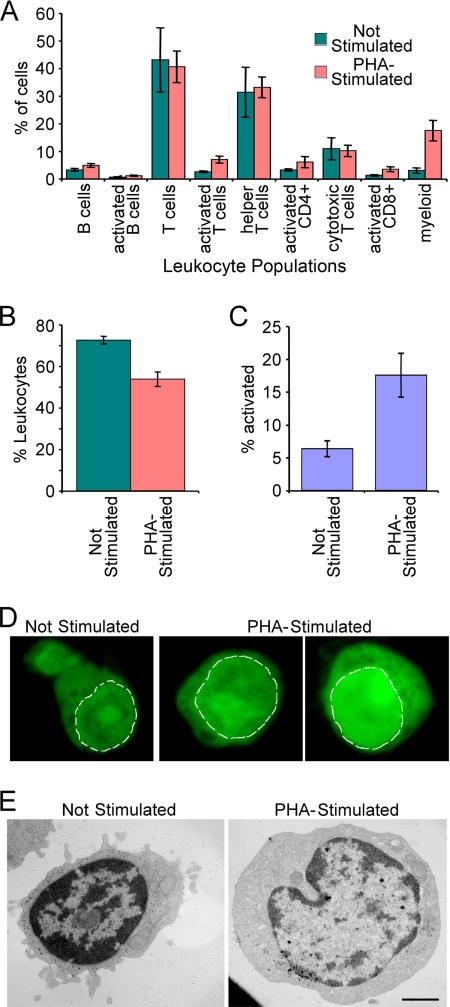
PBMC composition. A, cells treated as for NE purification were incubated with CD markers for different blood cell types and analyzed by flow cytometry. The percentage of each cell type for PBMC composition in leukocytes is graphed. B, percentage of leukocytes in the total population. C, percentage of lymphocyte activation in the different PBMC populations measured by appearance of surface markers. Error bars in A, B, and C indicate standard deviation. D, PHA activation gauged by changes in nucleotide distribution using acridine orange dye. Acridine orange intercalates more strongly with single-stranded DNA than double-stranded DNA, so intensity to some degree measures “open” DNA that is being actively transcribed. A dashed white line delineates the periphery of the nucleus. The unstimulated PBMCs have weak staining at the periphery of the nucleus and no staining in some central areas. PHA-activated lymphocytes have more uniform distributions and brighter staining, indicating more open DNA. E, PHA activation effects on chromatin organization assessed by electron microscopy. The unstimulated cell is smaller and has more compacted chromatin concentrated at the nuclear periphery. In the PHA-activated cell, much of this dense peripheral chromatin has become less compact, and both the cell and nucleus have increased in volume as the activated cells are now rapidly transcribing DNA and making protein. Images were taken at 11,000×. Scale bar, 1 μm.

