Fig. 6.
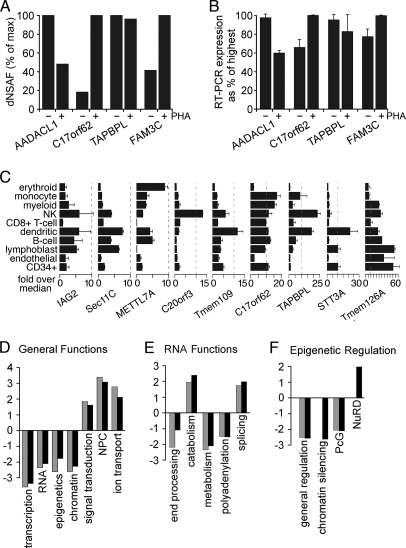
Differences in NE composition with PHA activation and effects on genome organization. A, differences in abundance estimated from dNSAF values for some NETs with or without PHA activation. dNSAF values were taken from the two most equivalent runs based on total protein coverage and identifications. B, RT-PCR of the NETs in A revealed reproducible differences in expression that are consistent with their abundance estimates based on peptide recoveries. C, transcript levels for several of the NETs identified differ among blood cell lineages. Data from the BioGPS transcriptome study comparing 84 different tissues/cell types are plotted relative to the median value over all 84 tissues sampled. Ticks along the bottom are for increments of 5-fold above the median. Each NET had its own unique expression pattern. Surface markers defining cell populations were CD71 for early erythroid cells, CD14 for monocytes, CD33 for myeloid cells, CD56 for natural killer (NK) cells, CD8 for T-cells, BDCA4 for myeloid dendritic cells, CD19 for B-cells, 721 for B-lymphoblasts, CD105 for endothelial cells, and CD34 for polyploidy progenitor cells. Error bars in B and C indicate standard deviation. D, within the subset of proteins in NE data sets with GO annotations, the fraction with a particular functional annotation was calculated. Similar fractions were calculated against all “nuclear”-annotated proteins in the GO database. The ratio of NE/nuclear fractions was then calculated, setting a 1:1 ratio to 0 so that positive values are -fold enrichment and negative values are -fold deficiency at the NE compared with the whole nucleus. Resting and activated PBMC data sets are represented by gray and black bars, respectively. E, the same analysis applied to the specific subset associated with RNA functions. F, the same analysis applied to the specific subset associated with functions in epigenetic regulation. PcG, Polycomb group.

