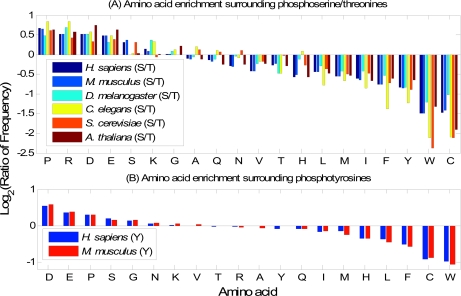
Fig. 4.
Comparisons of amino acid compositions in positive and negative data sets. A, comparisons between phosphoserines/threonines and non-phosphoserines/threonines in six organisms. The vertical axis represents the log2 ratio between amino acid frequencies surrounding phosphoserines/threonines and those surrounding non-phosphoserines/threonines. A value larger than 0 means the corresponding amino acid is enriched surrounding phosphoserines/threonines. The horizontal axis represents the 20 amino acids sorted in descending order by the mean log2 ratio. B, similarly, comparisons between phosphotyrosines and non-phosphotyrosines in H. sapiens and M. musculus (phosphotyrosine data in the other four organisms are too sparse to derive meaningful statistics).

