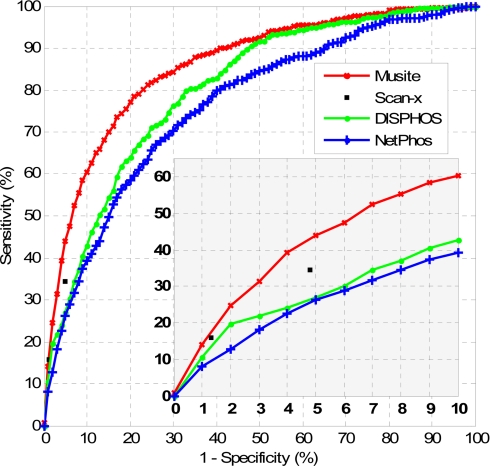
Fig. 6.
Comparison of phosphoserine/threonine prediction performances of NetPhos, DISPHOS, scan-x, and Musite. For NetPhos, DISPHOS, and Musite, the phosphoserine/threonine prediction scores were extracted, and the corresponding ROC curves were calculated and plotted. For scan-x, only specificities/sensitivities at the two supported stringency levels were plotted. The bottom right graph is the zoomed-in region with high prediction specificities (0.9–1).

