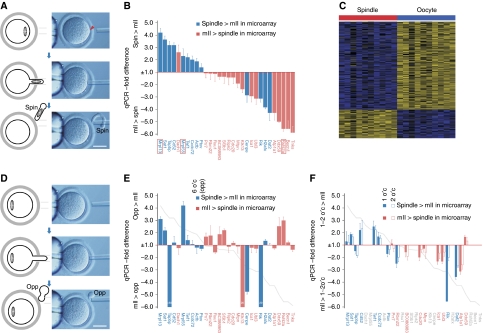
Figure 1.
Sub-cellular analysis of mII oocyte transcriptomes. (A) Hofmann images showing microsurgical mII oocyte spindle cortex sampling. The procedure does not cause plasma membrane breakage. (B) Comparative qPCR analysis of spindle–oocyte couplets, shown as −fold change in spindle RQ values relative to those of the oocyte. RQ values were normalized against H3f3a (Supplementary Figure S5). (C) Heat map representing the 384 transcripts detected at significantly different levels between spindle samples and their matching mII oocyte remnants. (D) Hofmann images showing microsurgical cortical sampling opposite (opp) the mII oocyte spindle (i.e., at 180°, or 6 o'clock, to the spindle). (E) Comparative qPCR analysis as per (B) (grey line plot) except that cortical samples were obtained from opposite the spindle. (F) Comparative qPCR analysis as per (B) (grey line plot) in which cortical sampling was at ∼30° (1 o'clock, 1 o'c) or ∼60° (2 o'clock, 2 o'c) to the metaphase plate. In (B, E and F), transcripts more abundant in the spindle by microarray analysis (+ve logFC; Supplementary Table S1) are shown in blue, and those more abundant in the enucleated mII oocyte remnant in pink. Bars in (A, D)=50 μm.

