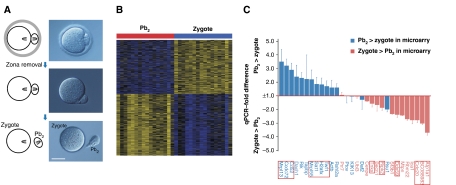
Figure 2.
Transcriptome analysis of individual Pb2–zygote couplets. (A) Hofmann images showing the separation of the Pb2 from its associated zygote ∼2.5 h post-fertilization. Bar=50 μm. (B) Heat map representing the 1069 transcripts that were significantly enriched or depleted in the Pb2 relative to matching zygotes. (C) Comparative qPCR analysis of Pb2–zygote couplets, shown as −fold change in Pb2 RQ values relative to those of the zygote, normalized as per Figure 1B. Transcripts shown by microarray analysis to be more abundant in the Pb2 (+ve logFC; Supplementary Table S3) are shown in blue, and those more abundant in the zygote in pink. Transcripts with adjusted P-values of <0.05 after analysis of microarray data (Supplementary Table S3) are boxed.

