Figure 3.
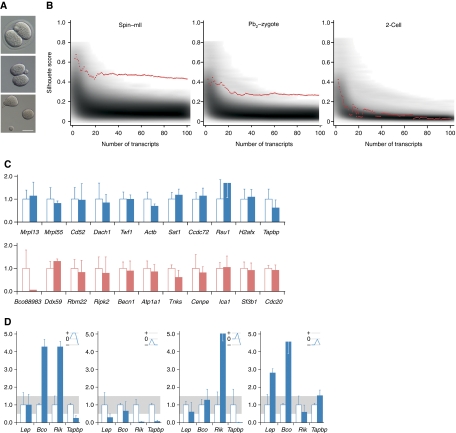
No programmed transcriptome sorting between 2-cell embryo sister blastomeres. (A) Two-cell embryo (top) blastomere separation (Hofmann) showing zona removal (centre) and separated blastomeres. Bar=50 μm. (B) Clustering analysis. Red lines display separation strengths (y axis) of a clustering using the top N separating transcripts (x axis). Grey background shading indicates the distribution of matching random separation strengths. Sub-plots show analyses of spindle–oocyte remnants (left), Pb2–zygote couplets (centre) and 2-cell blastomeres (right). (C) qPCR analysis of 2-cell blastomeres for transcripts as per Figure 1B. The value for one randomly selected blastomere is shown relative to that of its sister, set at 1.00. (D) Levels of the transcripts that differed most between 2-cell blastomeres were co-determined in the same four 2-cell embryos (numbered 1–4) as per Figure 1B. Blue lines in upper right hand panels represent expression level changes; small changes (0.5–1.5, grey band) are represented as 0, and an increase or decrease as + or −, respectively. No given profile is superimposable on any other or its reciprocal, which is inconsistent with co-segregation of the transcripts analysed.

