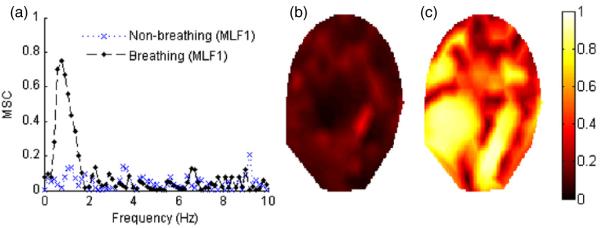
Figure 5.
(a) MSC-frequency plot for subject 1 (MLF1 sensor and UFBM signal) during breathing and non-breathing periods are shown. (b) and (c) represent the contour plots corresponding to the distribution of the maximum MSC values calculated for the frequencies between 0.5 and 2 Hz for 151 sensors during 1 min non-breathing and breathing episodes, respectively.

