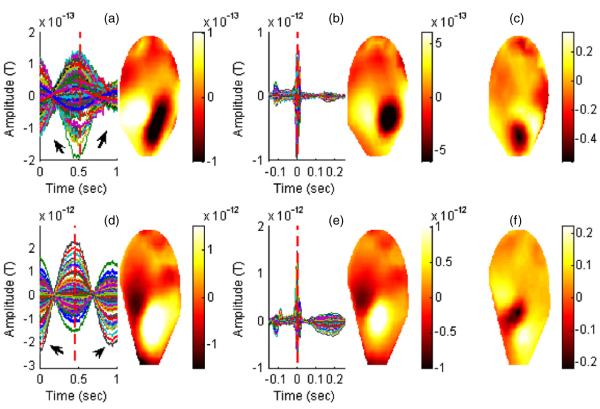
Figure 8.
Averaged FBM and the cardiac cycle waveforms derived from the fMEG-mMCG signals are shown for subject 1 in (a) and (b) and subject 2 (d) and (e). The contour plots correspond to the distribution of the magnetic fields for the averaged waveforms in the sensor domain at the time point shown by the vertical red line; (c) and (f) show the normalized difference map (FBM minus cardiac cycle).

