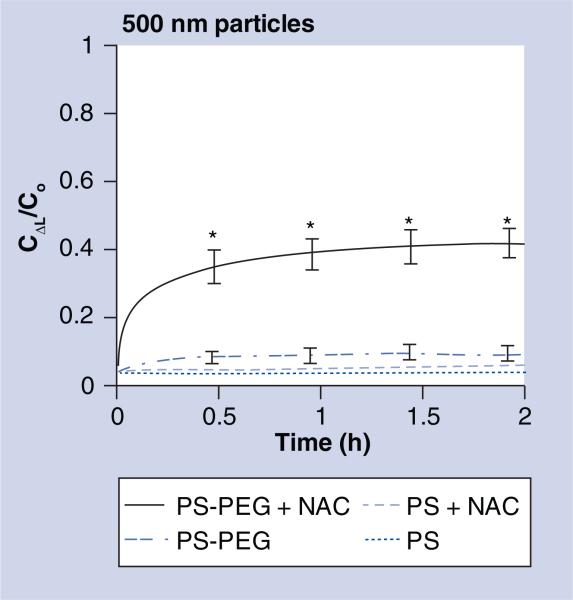
Figure 4. Fraction of 500 nm uncoated (PS) and polyethylene glycol-coated (PS-PEG) particles that are expected to penetrate 10 μm cystic fibrosis sputum layer over time.
Ratio of particle concentration at ΔL = 10 μm deep (CΔL) to initial particle concentration at the surface (Co) over time. Data represents three individual experiments, with n > 200 particles for each experiment. Error bars indicate standard error of the mean.
*Statistically significant differences compared with three other conditions (p < 0.01).
C: Concentration; NAC: N-acetyl cysteine; PEG: Polyethylene glycol; PS: Polystyrene.

