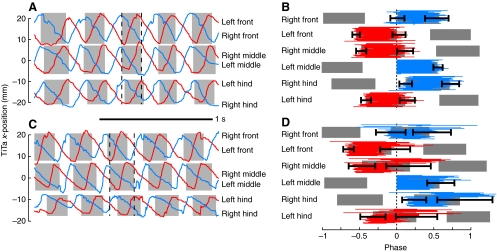
Fig. 6.
Motion plots and footfall rasters for two different bouts of walking by the same animal walking at the same speed. The upper bout had consistently low values (mean=0.09) of the tripod coordination index (TCI; see text), whereas the lower bout had much higher TCI (mean=0.19). (A,C) Forward–backward motion of the TiTa points of each of the six legs. Traces are colored according to the tripod set to which each leg belongs, i.e. the same color is used for all the legs that move together. (B,D) Phase-adjusted raster of step timing. The thin red and blue bars represent the stance period for a single stride by each leg, aligned to steps by the left middle leg. The colors of the bars match the colors in A and C. The gray boxes denote the average stance period for each leg (the mean of the colored bars), and the black whiskers show the standard deviation of the starting and ending phase of stance. The steps taken by the legs of a single tripod group were more tightly aligned, on average, and less variable for the trial in B than for the trial in D; i.e. the steps shown in B generally had smaller TCI values.

