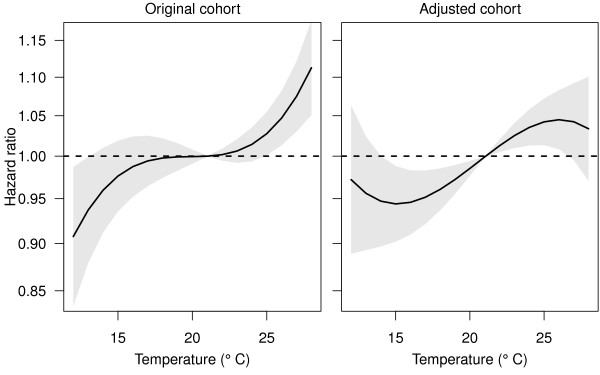
Figure 5.
The estimated effect of temperature on gestation length in the original Brisbane cohort (left) and the adjusted cohort (right). The solid line shows the mean hazard ratio and the grey area the 95 confidence limits. The dotted horizontal line at 1 represents no change in gestation length. The reference temperature is 21°C.

