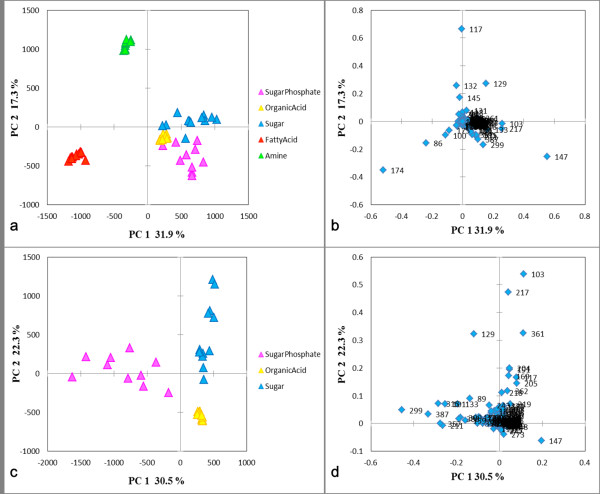
Figure 1.
Model evaluation. (a), (b) The PCA score and loading plot including all compound groups. (c), (d) The score and loading plot including organic acid, sugar, and sugar phosphate groups. Mean centering was used in the data preprocessing. The legend shows each metabolite group. X-axis and Y-axis describe the first and second PCs, respectively.

