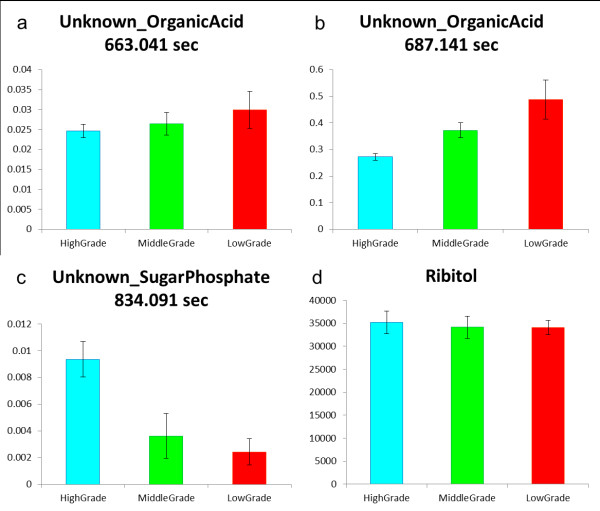
Figure 3.
Annotated peaks information. (a), (b), (c) The peak height of three important metabolites for describing the tea grade in the second PC space. (d) The peak height of ribitol. The peaks of the annotated metabolites were scaled relative to the ribitol peak. The graph title indicates their annotated names and their respective retention times. These three peaks clearly varied with tea quality.

