
Figure 6.
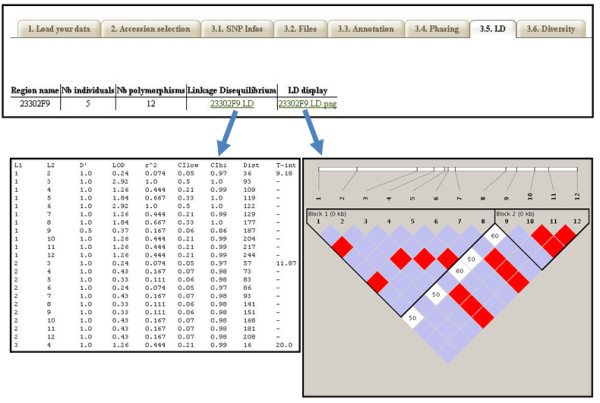
Haplotype blocks and LD visualization with Haploview. for each genomic region submitted to SNiPlay, LD scores are calculated for each SNP pairs using the phased genotypes and reported in a LD plot generated by Haploview (via the Gevalt program).