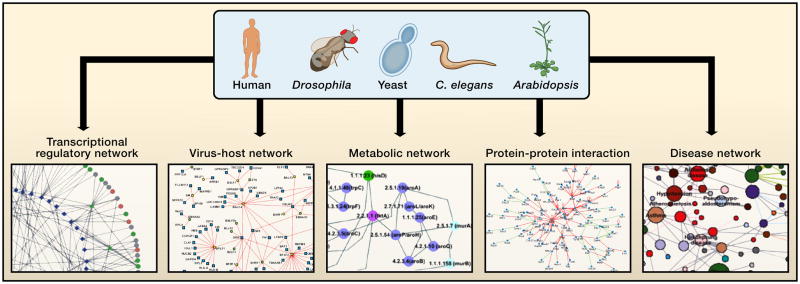
Figure 2. Networks in cellular systems.
To date cellular networks are most available for the “super-model” organisms (Davis, 2004) yeast, worm, fly, and plant. High-throughput interactome mapping relies upon genome-scale resources such as ORFeome resources, a segment of which is shown in the background. Several types of interactome networks discussed are depicted around the periphery. In a protein interaction network nodes represent proteins and edges represent physical interactions. In a transcriptional regulatory network nodes represent transcription factors (circular nodes) or putative DNA regulatory elements (diamond nodes) and edges represent physical binding between the two. In a gene-disease network, nodes represent disease genes and edges represent genes mutation of which is associated with disease. In a virus-host network nodes represent viral proteins (square nodes) or host proteins (round nodes) and edges represent physical interactions between the two. In a metabolic network nodes represent enzymes and edges represent metabolites that are products or substrates of the enzymes. The network depictions seem dense, but they represent only small portions of available interactome network maps, which themselves constitute only a few percent of the complete interactomes within cells.

