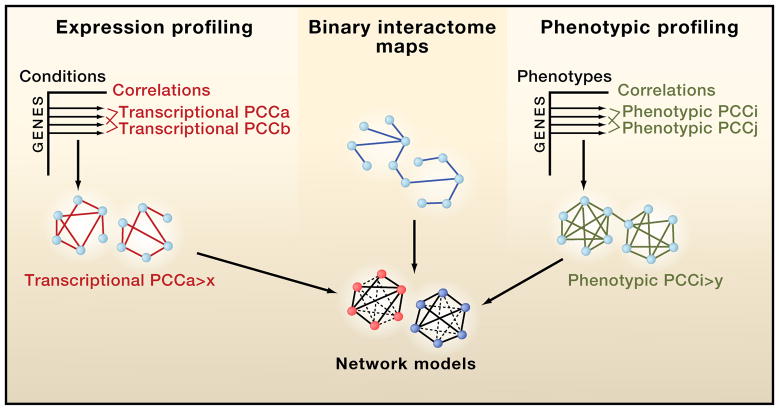
Figure 3. Integrated networks.
Co-expression and phenotypic profiling can be thought of as matrices comprising all genes of an organism against all conditions that this organism has been exposed to within a given expression compendium and all phenotypes tested, respectively. For any correlation measurement, Pearson Correlation Coefficients (PCCs) being one of the most widely used, the threshold between what is considered co-expressed and non-co-expressed needs to be set using appropriate titration procedures. The resulting integrated networks have powerful predictive value.

