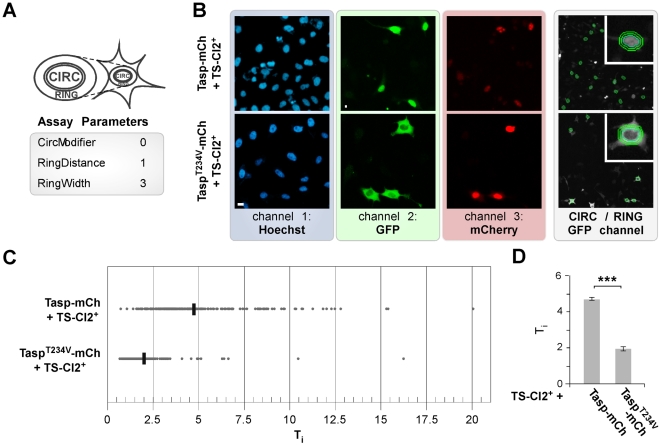
Figure 2. Biosensor assay adaptation onto a HTS platform.
A. Object selection parameters for nuclear (CIRC) and cytoplasmatic compartment (RING) analysis. B. Biosensor translocation assay analysis using the Cellomics Arrayscan® VTI platform. HeLa transfectants coexpressing TS-Cl2+ and active or inactive (TaspT234V) mCherry fusions were fixed 48 h post transfection and nuclei marked by Hoechst 33342. The Hoechst 33342, GFP, and mCherry signals were recorded in channels 1, 2 and 3, respectively. Overlay with the CIRC mask and RING region is outlined for GFP (right panel). Representative images are shown. Scale bar, 10 µm. C. Translocation index (Ti = CIRC∶RING) plotted for coexpression of Tasp1-mCh variants on a single cell basis. Values were derived from analyzing ∼400 cells/well. Mean from three wells is indicated. D. Ti was highly significantly increased upon coexpression of active compared to inactive Taspase1 (***: p<0.0001). Columns, mean; bars, SD.

