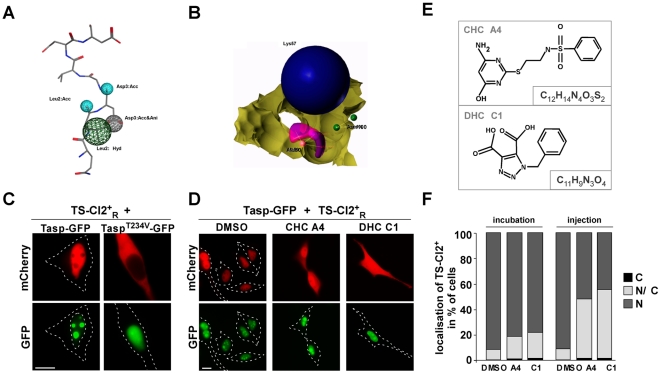
Figure 3. In vivo analysis of potential Taspase1 inhibitors.
A./B. Pharmacophore-queries for virtual screening. A. Four-point MOE pharmacophore model based on the docked substrate QLDGVDD (shown as sticks coloured by element) together with the assigned pharmacophoric features (cyan: acceptor, green: hydrophobic, grey: acceptor and anion, left panel) B. Receptor-based SYBYL three-point pharmacophore model representing a negative charge (blue spheres) interacting with Lys57, hydrogen-bond donor (magenta) interacting with Ala50 and acceptor (green) interacting with Asn100 (right panel). The yellow surface indicates excluded volume. C. Expression of Tasp-GFP but not of inactive TaspT234V-GFP induces nuclear accumulation of the red fluorescent biosensor, TS-Cl2+R, in HeLa transfectants. D. CHC-A4 and DHC-C1 partially inhibited TS-Cl2+R translocation. HeLa cell transfectants coexpressing TS-Cl2+R and Taspase1-GFP were treated with DMSO or compounds (50 µM final concentration), and analyzed 48 h later. Representative examples are shown. Scale bars, 10 µm. Dashed lines mark nuclear/cytoplasmic cell boundaries obtained from the corresponding phase contrast images. E. Structures and formulas of the respective compounds. F. Intracellular delivery of the compounds by microinjection resulted in enhanced inhibition. Vero cell transfectants coexpressing TS-Cl2+R and Taspase1-GFP were either treated with DMSO or compounds (50 µM final concentration) or microinjected. 48 h later, the percentage of cells showing cytoplasmic (C), cytoplasmic and nuclear (N/C) or nuclear (N) fluorescence was determined for at least 100 sensor expressing cells.

