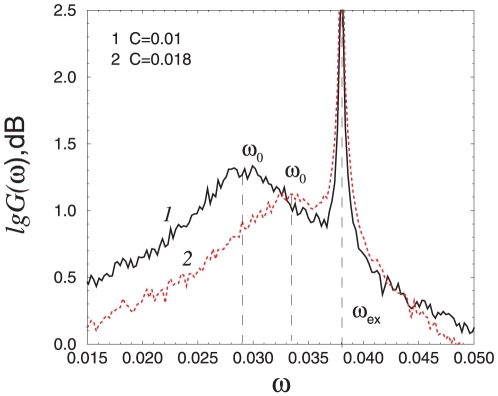
Figure 6. The power spectra for a single oscillator in the presence of noise and external harmonic forcing for  ,
,  and different values of the external force amplitude
  (indicated in the figure).
The eigenfrequency is marked as  . The frequency of the external forcing is
  . For convenience of the comparison of the results, the spectral power density
  is not normalized here.

