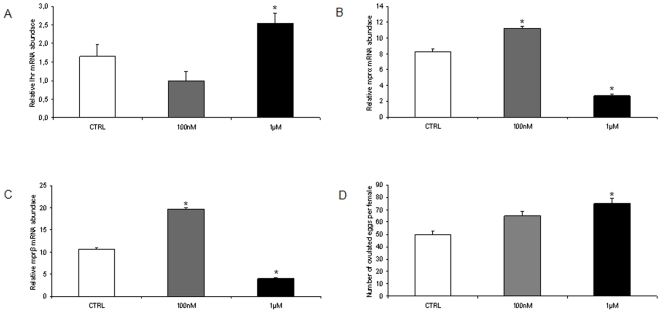
Figure 5. In vivo effects of melatonin on follicle maturation factors.
(A) lhr, (B) mprα and (C) mprβ mRNA levels, normalized against β-actin gene in fish exposed to 100 nM and 1 µM MEL. n = 20 oocytes per group. Error bars indicate mean±S.D. (D) Number of ovulated eggs per female in fish exposed to 100 nM and 1 µM MEL. Asterisks denote exposure groups that are significantly different from the relative control group (CTRL) (p<0.05), analyzed using ANOVA followed by Bonferroni's multiple comparison test.

