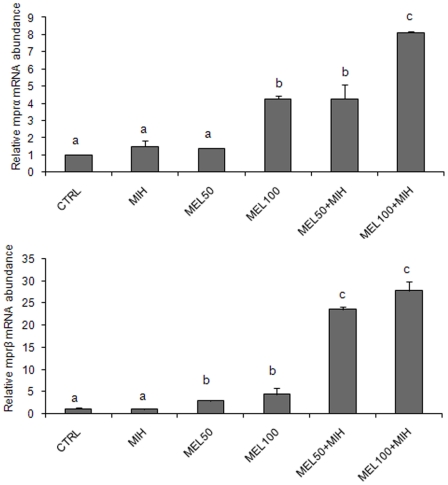
Figure 7. mprα and mprβ m RNA levels in class IIIB follicle.
(A) mprα and (B) mprβ m RNA levels, normalized against β-actin gene in class IIIB follicle after exposure to 50 and 100 pg/ml of MEL, alone or in combination with the MIH. The different letters indicate statistically significant differences (P<0.05), analyzed using ANOVA followed by Bonferroni's multiple comparison test.

