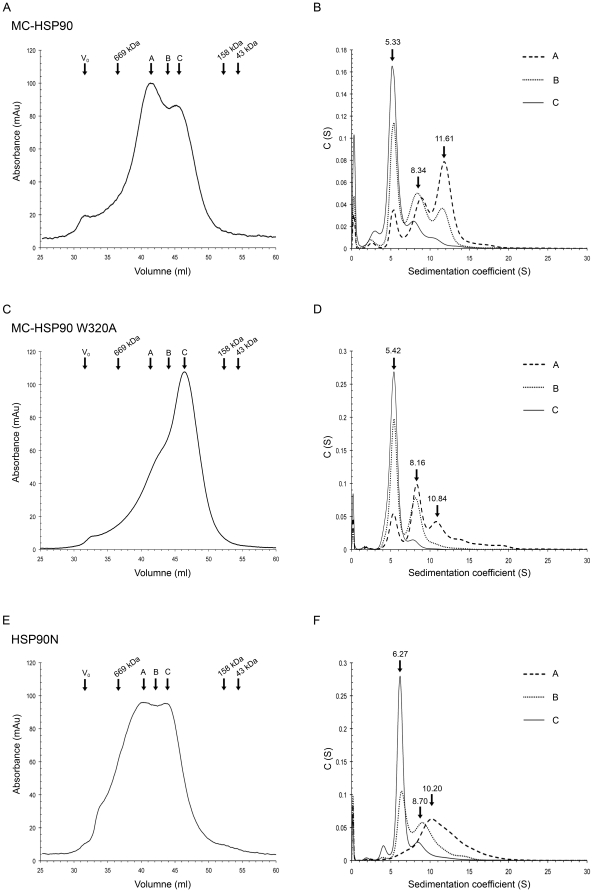
Figure 6. Oligomer states of MC-HSP90 and HSP90N.
(A) (C) (E) The elution profiles of MC-HSP90, the mutant W320A, and HSP90N were recorded using size exclusion chromatography column S300. The void volume (V0) and retention volume of protein molecular weight standards and the positions of peaks (peak A and peak B) and overlap regions (region C) of proteins are shown above the curves. (B) (D) (F) The sedimentation coefficient distribution profiles of the protein samples from peak A, peak C, and the overlap region (B) from S300. The predicted sedimentation coefficients by SEDFIT for dimer, tetramer, and hexamer of MC-HSP90, W320A and HSP90N are indicated.

