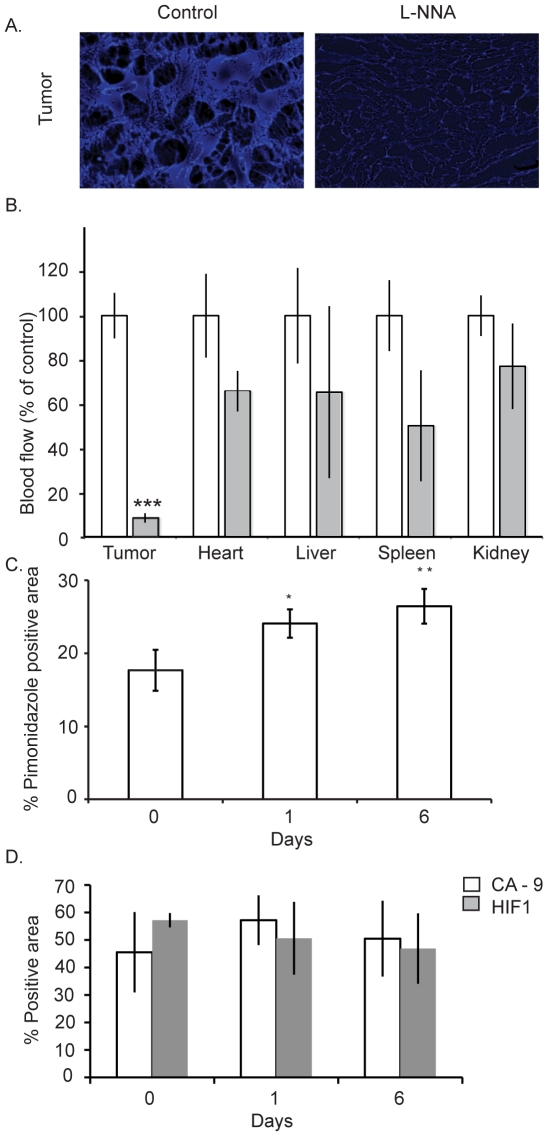
Figure 4. L-NNA treatment decreases tumor blood flow and increases hypoxia.
Comparison of tissue vasculature from L-NNA treated and control mice. Example direct fluorescent images from control and L-NNA treated A431 tumors (A). Quantification of decreased blood flow to tumors and other tissues following L-NNA treatment (B). Blood flow was determined by tissue penetration of i.v. injected fluorescent beads within 3 minutes of injection. Data presented as mean intensity as a percentage of control ± SEM; n = 5; *** = p<0.01. A431 tumor hypoxia following L-NNA treatment measured immunohistochemically by pimonidazole (C), carbonic anhydrase IX and HIF-1α expression (D).

