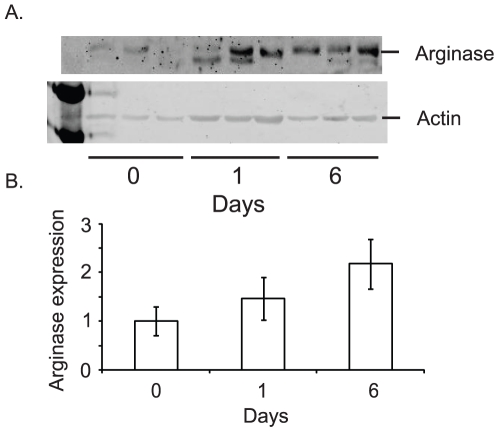
Figure 6. Arginase II expression increases following L-NNA exposure.
Western blots of arginase II and actin expression in A431 xenografts prior to and following 1 and 6 days of L-NNA treatment (A). Quantification of relative arginase II expression standardized to actin (B). Data presented as mean ± SEM; n = 3, * = p<0.05.

