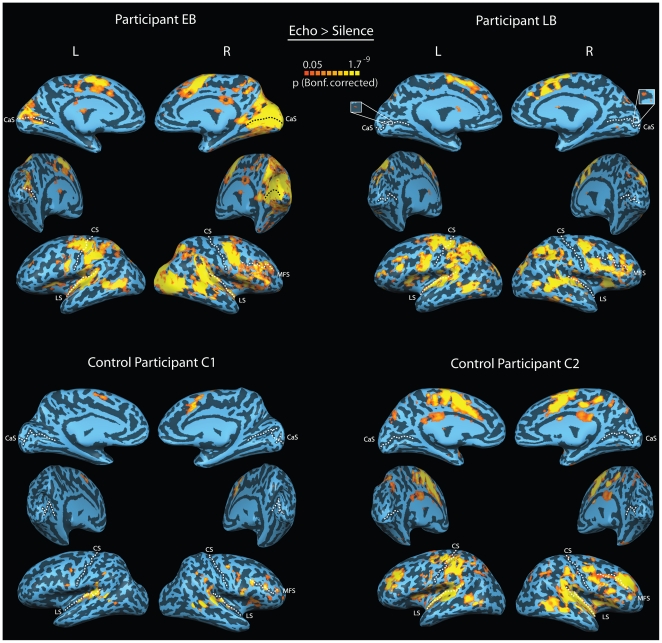
Figure 2. BOLD activity projected on participants reconstructed and partially inflated cortical surface.
Concavities and convexities are colored dark and light, respectively. CS-central sulcus, CaS-calcarine sulcus, LS- lateral sulcus, MFS – middle frontal sulcus. Top panel: BOLD activity while EB and LB listened to recordings of their own echolocation sounds that had been made in an anechoic chamber and judged the location (left vs. right), shape (concave vs. flat) or stability (moving vs. stationary) of the sound reflecting surface (see Figure 1F for behavioral results). Bottom Panel: BOLD activity while C1 and C2 listened to recordings they had trained with, i.e. EB and LB's echolocation sounds, respectively. Just as EB and LB, C1 and C2 judged the location (left vs. right), shape (concave vs. flat) or stability (moving vs. stationary) of the sound reflecting surface (see Figure 1F for behavioral results). Both EB and LB, but not C1 or C2, show reliable BOLD activity in calcarine sulcus, typically associated with the processing of visual stimuli. EB shows more BOLD activity in calcarine sulcus than LB. All subjects (except C2) also show BOLD activity along the central sulcus (i.e. Motor Cortex) of the left hemisphere, most likely due to the response related right-hand button press. All subjects also show BOLD activity in the lateral sulcus (i.e. Auditory Complex) of the left and right hemispheres and adjacent and inferior to the right medial frontal sulcus. The former likely reflects the auditory nature of the stimuli. The latter most likely reflects the involvement of higher order cognitive and executive control processes during task performance.

