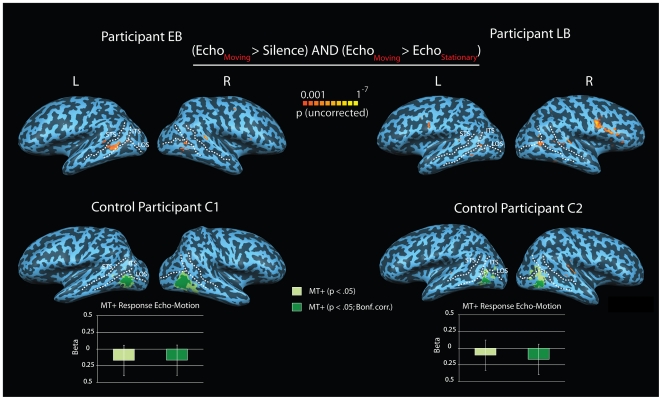
Figure 5. BOLD activity projected on participants reconstructed and partially inflated cortical surface.
Concavities and convexities are colored dark and light, respectively. STS-superior temporal sulcus, ITS -inferior temporal sulcus, LOS – lateral occipital sulcus. Top Panel: BOLD activity related to recordings of echolocation sounds conveying movement to EB and LB. Both EB and LB show significant activity in regions adjacent and inferior to the ITS/LOS junction, that are typically involved in motion processing. Bottom Panel: BOLD activity in C1 and C2's brain related to recordings of echolocation sounds that convey movement to EB and LB. Even though C1 and C2 could reliably classify echolocation sounds as ‘moving’ or ‘stationary’, they reported to not perceive any sense of movement. Also shown are areas sensitive to visual motion (area MT+) functionally defined at different significance levels (p<.05: light green or p<.05 Bonf. Corrected: dark green). Bar graphs show beta weights (+/− SEM) obtained from a region of interest analysis applied to areas MT+ (contrast: EchoMoving>EchoStationary). Bar color denotes the MT+ used for the ROI analysis (i.e. MT+ defined at p<.05: light green, or p<.05; Bonf. Corrected: dark green). In contrast to EB and LB, neither C1 nor C2 show increased BOLD activity in regions adjacent and inferior to the ITS/LOS junction for the contrast between ‘moving’ and ‘stationary’ echolocation stimuli, even at more liberal statistical thresholds (see Figure S4). The statistically more powerful region of interest analysis applied to area MT+ was not significant either, i.e. SEM error bars (and therefore any confidence interval) include zero (see also Table S3).

