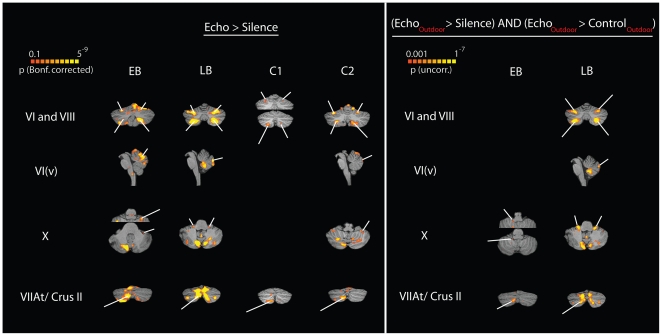
Figure 6. BOLD activity in the cerebellum.
Data are shown in neurological convention, i.e. left is left. Activity in the cerebellum was analyzed in stereotaxic space [49]. To evaluate significance of activity we used the same voxelwise significance thresholds as for cortical surface analyses for each participant. However, because the number of voxels in volume space differed from the number of vertices in surface space for each participant, the Bonferroni corrected significance level differs between cortex and cerebellum (compare Figure 2). To increase accuracy, cerebellar structures for each participant were identified based on anatomical landmarks. Structures were labeled according to the nomenclature developed by [26]. Left panel: BOLD activity while participants listened to recordings of echolocation sounds that had been made in an anechoic chamber and judged the location (left vs. right), shape (concave vs. flat) or stability (moving vs. stationary) of the sound reflecting surface (see Figure 1F for behavioral results). Right Panel: Contrast between BOLD activations for recordings containing echoes from objects and recordings that did not contain such echoes. Data are not shown if no significant activity was found (empty cells in table).

