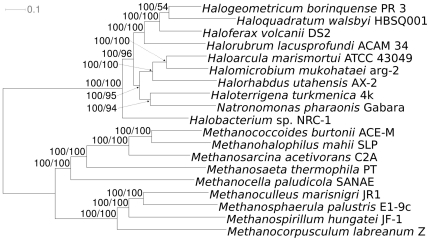
Figure 1. Maximum likelihood (ML) phylogenetic tree inferred from the 3,853-gene supermatrix.
The branches are scaled in terms of the expected number of substitutions per site. Numbers above branches are support values from ML (left) and maximum parsimony (MP; right) bootstrapping. The tree was rooted with the Methanomicrobia genomes included in the sample. The topology of the single best MP tree was identical to the one depicted here.

