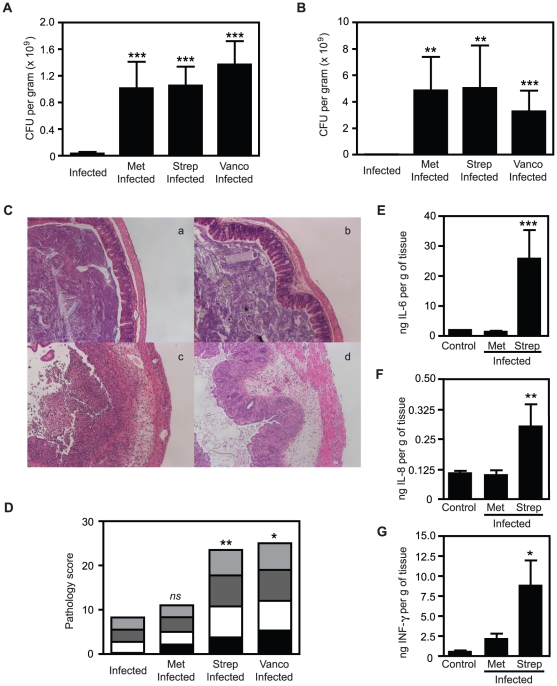
Figure 1. Different antibiotic treatments lead to different degrees of intestinal pathology in 129S1/SvImJ mice.
A. S. Typhimurium levels in caeca of 129S1/SvImJ mice after 4 days of infection with or without antibiotic treatment. B. S. Typhimurium levels in feces of 129S1/SvImJ mice after 4 days of infection with or without antibiotic treatment. C. H&E staining of caeca of 129S1/SvImJ mice. (a). infected 129S1/SvImJ mice; (b). metronidazole-treated and infected 129S1/SvImJ mice; (c). streptomycin-treated and infected 129S1/SvImJ mice; (d). vancomycin-treated and infected 129S1/SvImJ mice. D. Pathology scores of caeca of 129S1/SvImJ mice after 4 days of infection with or without antibiotic treatment. E. Levels of IL6 in caecal samples measured by ELISA. F. Levels of IL8 in caecal samples measured by ELISA. G. Levels of IFNγ in caecal samples measured by ELISA. Met: metronidazole (750 mg/L), Strep: streptomycin (450 mg/L) and Vanco: vancomycin (50 mg/L). Black bars represent pathology scores of the intestinal lumen, white bars represent scores of the surface epithelia, dark grey bars represent scores of the mucosa and light grey bars represent scores of the submucosa of the tissue. ns: not significant; *: p<0.05; **: p<0.01; ***: p≤0.001. Experiments were performed three times with at least 4 mice in each group.

