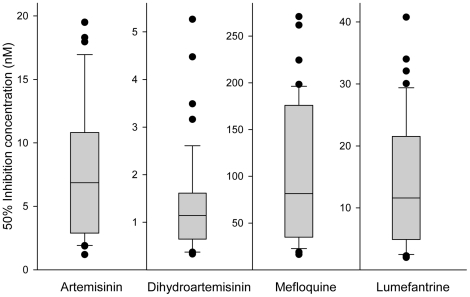
Figure 1. In vitro antimalarials 50% inhibition concentration variance within the isolates.
Data are represented in boxplot. The lower and upper quartiles of the box are 25th and 75th percentile, respectively and the band near the middle of the box is the median. End of the whiskers represent the 10th and 90th percentile. Dots represent outliers.

