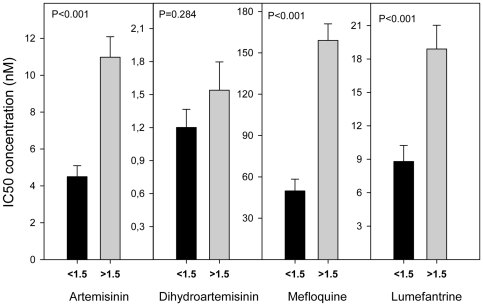
Figure 2. Significant association of pfmdr1 copy number variation and in vitro IC50's for ART, MQ and LUM.
Significant relationship between average in vitro drugs tested IC50's and pfmdr1 CNV polymorphism. Data described in Table S2. <1.5: 1 gene copy of pfmdr1 (#22 isolates). >1.5: 2 and 3 gene copies of pfmdr1 (#24 isolates). T-test statistics was applied. P value <0.0042 is consider significant after Bonferroni correction. Error bars represent SE.

