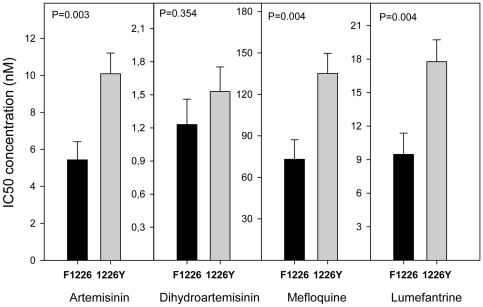
Figure 3. Significant association of pfmdr1 F1226Y and IC50's for ART, MQ and LUM.
Significant relationship between average in vitro drugs tested IC50's and pfmdr1 F1226Y polymorphism. Data described in Table S2. Black bars are average IC50 of 22 isolates with F1226 allele. Grey bars are average IC50 of 23 isolates with 1226Y allele. T-test statistics was applied. P value <0.0042 is consider significant after Bonferroni correction. Error bars represent SE.

