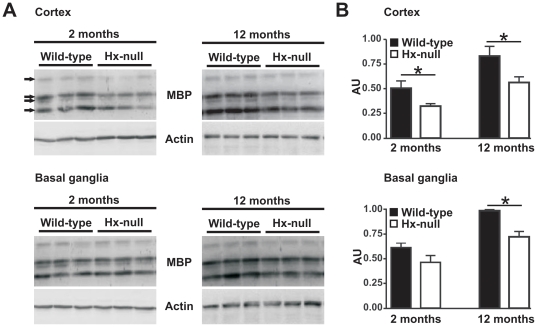
Figure 1. Reduction of MBP protein production in Hx−/− brain.
A) Western blot analysis of MBP expression in brain extracts of wild-type and Hx−/− mice. Cerebral cortex and basal ganglia region lysates were analyzed at two and twelve months of age. Representative experiments are shown. B) Band intensities were measured by densitometry and normalized to actin expression (AU: Arbitrary Unit). The overall MBP production was obtained by summing the relative intensities of the four isoforms recognized by the antibody (indicated by arrows in scanned gels). Densitometry data represent mean ± SEM; n = 3 for each genotype. * = P<0.05. Results shown are representative of three independent experiments.

