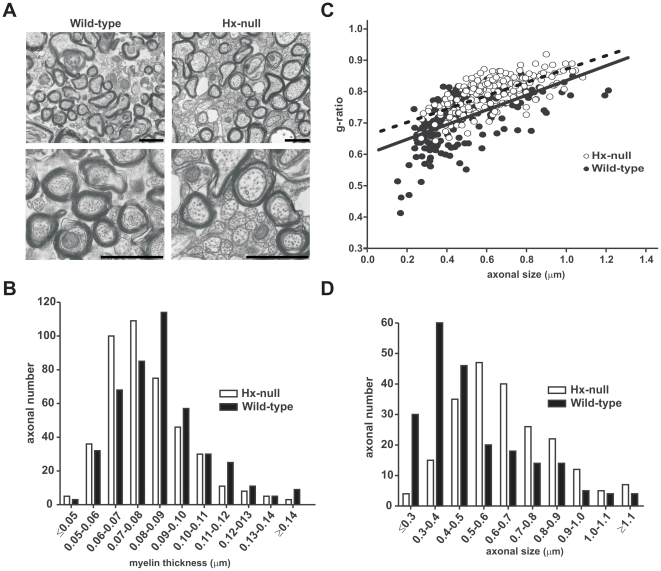
Figure 3. Alteration of myelin ultrastructure in the absence of Hx.
EM analysis was performed on the corpus callosum of wild-type and Hx−/− mice at twelve month of age. A) Electron micrographs show that in Hx−/− mice the axons are hypomyelinated and the number of small myelinated axons is reduced in comparison to wild-types. Bar = 1 µm. B) The distribution of myelin thickness in wild-type and Hx−/− mice fibers demonstrated that myelin sheath was thicker in Hx−/− fibers. P<0.0001. C) g-ratio scatter diagram in wild-type and Hx−/− mice fibers. Elevated g ratio values were observed for all axons in Hx−/− mice, indicating that impaired myelination affected axon of all sizes. P<0.001. D)The distribution of axonal size in wild-type and Hx−/− mice fibers showed that Hx−/− mice had bigger axons compared to controls. P<0.0001. n = 5 mice for each genotype.

