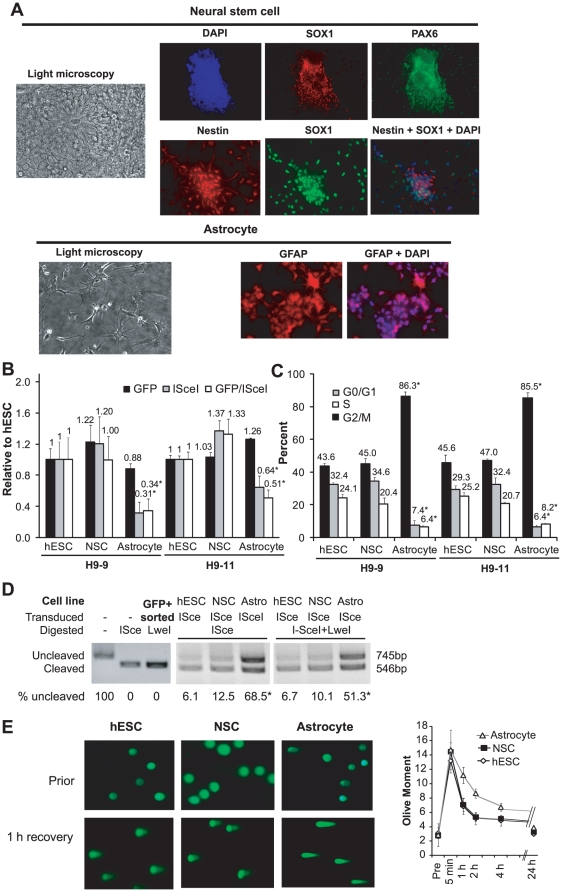
Figure 6. Repair at an I-SceI DSB in neural lineage cells.
A. Light and immunofluorescence microscopy after differentiation of hESCs. DAPI indicates cellular nuclei. Neural stem cells are positive for SOX1, PAX6 and Nestin, while astrocytes are positive for GFAP. B. Percent GFP+ cells after GFP or I-SceI transduction relative to hESCs in two clones differentiated into NSCs and astrocytes. "GFP/ISceI" indicates the ratio of relative values. * indicates p<0.01 compared to hESCs from the same clone. Error bars indicated one standard deviation. C. Cell cycle distribution in two hESC clones and their differentiated NSCs and astrocytes. D. PCR amplification of the sequence flanking the I-SceI site from cells 96 hours after I-SceI transduction. PCR product was digested with I-SceI, LweI or both. "GFP+ sorted" cells were utilized as a control to demonstrate complete LweI cleavage. E. Comet assay at select time points after irradiation with 2 Gy. Examples are shown of cells quantified by comet assay either prior to or one hour after 2 Gy.

