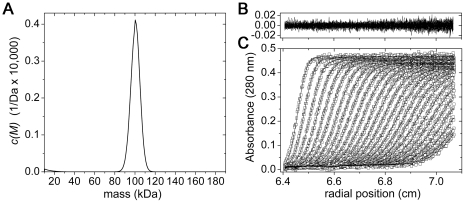
Figure 5. Sedimentation velocity analysis of Cr-DapL at 9.2 µM.
A) Continuous mass, c(M), distribution is plotted for Cr-DapL (solid line), suggesting a mass of ∼100 kDa. The predicted mass of the dimer is 97.66 kDa. Analysis was performed using the program SEDFIT [26], [27] at a resolution of 200, with massmin = 10 kDa, massmax = 180 kDa and at a confidence level (F-ratio) = 0.95. Statistics for the nonlinear least squares best fits were r.m.s.d. = 0.005, runs test-Z = 3. Residuals (B) for the c(M) distribution best fits (C) plotted as a function of radial position (cm) from the axis of rotation for Cr-DapL at 9.2 µM.

