Figure 4.
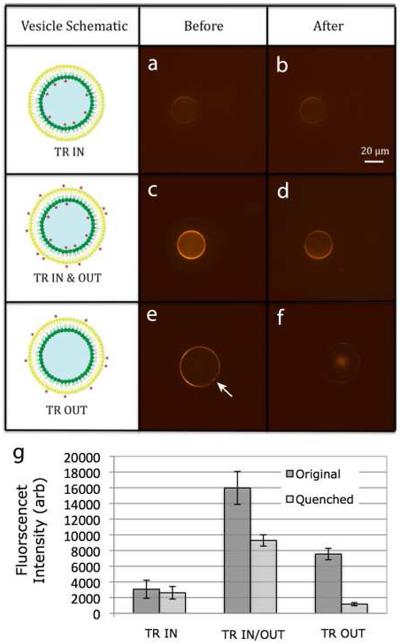
Fluorescence quenching to demonstrate vesicle asymmetry. The two columns of panels show representive vesicle confocal fluorescence images before (a, c, e) and after (b, d, f) the addition of an energy-transfer quenching agent. This experiment was performed for vesicles with fluorophore only on the inner leaflet (a, b), on both leaflets (c, d), and only on the outer leaflet (e, f). Average fluorescent intensities before and quenching are plotted in (g) for a set of three vesicles of each type. The arrow in (e) indicates a spot of elevated fluorescence likely corresponding to oil retained in the membrane bilayer. Scale bar is 20 μm, and applies to all images. Error bars are ± one standard deviation.

